
The revolution has arrived. Up to the release of the Samsung 850 PRO, the most common strategy was to shrink the die to increase higher bit densities in order to reduce cost and while offering higher capacity. Shrinking a planar layout can only take you so far. Sure, 2D NAND does work and it is still widely used by the main SSD manufacturers. With consecutive “world first”, TLC and today V-NAND technology, Samsung is not your typical SSD manufacturer. Instead of working around the inherent limitation of the planar architecture, Samsung came up with a new approach, stacking instead of shrinking.
The direct benefits of the Samsung V-NAND are:
- Higher Capacity
- Faster throughput
- Higher Endurance
- Better power efficiency
Enters the 3D V-NAND. Introduced last year, the new flash memory can stack as many as 24 cell layers vertically and was aimed at enterprise and data center environment. This time, the 850 PRO series equipped with the 2nd generation of 3D V-NAND, 32 cell layers, hits the consumer market. Available capacities are 128GB, 256GB, 512GB and 1TB (1024GB).
Specifications
| Usage Application | Client PCs | ||
| Capacity | 128GB, 256GB, 512GB, 1TB(1024GB) | ||
| Dimensions (LxWxH) | 100 x 69.85 x 6.8 (mm) | ||
| Interface | SATA 6Gb/s (backward compatible) | ||
| Form Factor | 2.5 inches | ||
| Controller | Samsung 3-core MEX Controller | ||
| NAND Flash Memory | Samsung 32 layer 3D V-NAND | ||
| DRAM Cache Memory | 256MB (128GB) or 512MB (256GB&512GB) or 1GB (1TB) LPDDR2 | ||
| Performance* | Sequential Read: | Max. 550 MB/s | |
| Sequential Write**: | Max. 520 MB/s (256GB/512GB/1TB) | ||
| Max. 470 MB/s (128GB) | |||
| 4KB Random Read (QD1): | Max. 10K IOPS | ||
| 4KB Random Write (QD1): | Max. 36K IOPS | ||
| 4KB Random Read (QD32): | Max.100K IOPS | ||
| 4KB Random Write (QD32): | Max. 90K IOPS | ||
| TRIM Support | Yes (Requires OS Support) | ||
| Garbage Collection | Yes | ||
| S.M.A.R.T | Yes | ||
| Data Security | AES 256-bit Full Disk Encryption (FDE) | ||
| TCG/Opal V2.0, Encrypted Drive (IEEE1667) | |||
| Weight | Max. 66g (1TB) | ||
| Reliability | MTBF: 2 million hours | ||
| TBW | 150 TBW | ||
| Power Consumption | Active Read (Average): Max. 3.3W (1TB) | ||
| Active Write (Average): Max. 3.0W (1TB) | |||
| Idle: Max. 0.4W | |||
| Device Sleep: 2mW | |||
| Temperature | Operating: | 0°C to 70°C | |
| Non-Operating: | -40°C to 85°C | ||
| Humidity | 5% to 95%, non-condensing | ||
| Vibration | Non-Operating: | 20~2000Hz, 20G | |
| Shock | Non-Operating: | 1500G, duration 0.5m Sec, 3 axis | |
| Warranty | 10 years limited | ||
Pricing
| Description | Capacity (GB) | Model | SRP | $/GB |
| 850 Pro Series SATA III 2.5″ (Ship on 7/21/2014) |
128 | MZ-7KE128BW | $129.99 | $1.02 |
| 256 | MZ-7KE256BW | $229.99 | $0.90 | |
| 512 | MZ-7KE512BW | $429.99 | $0.84 | |
| 1024 | MZ-7KE1T0BW | $729.99 | $0.71 |
Internals and Features
3D V-NAND
Current flash memory is a planar or single layer. Higher density is obtained by shrinking the die as more cells are crammed into the same space. As the cells are getting closer and closer, error rates are getting higher (caused by interference between adjacent cells), which translates into more retries, which in turn translates into performance hit. Keep in mind, SLC stores 1 bit per cell, MLC, 2 bits per cell and TLC, 3 bits per cell. The more bits per cell, the less margin for error there is for voltage changes, in term of write I/O.

Scaling limitation Technology. (Credit: Samsung)
V-NAND is a combination of two technologies, “Charge Trap Flash” and vertical layers stacking.
With CTF technology, the charge is not stored in the floating gate, but on the silicon nitride layer, an insulator. CTF also allows lower programming voltage, which as a result increase endurance, i.e. more P/E cycles and reduce power consumption.
By stacking layers, there is now more real estate for the cells in size and distance in between. Bigger, means more room for voltage state changes, meaning less prone to errors, equals better performance. Since there is more space between cell, there is less interference.

“Charge Trap Flash”. (Credit: Samsung)
Samsung is confident that they can double the die density every year just by adding more layers. To put things in perspective, we should be seeing 2TB drive by 2015, 4TB by 2016 and 8TB by 2017. In summary, the V-NAND solved most of the 2D NAND challenges, capacity, performance, endurance and power consumption.

Vertical Stacking Technology. (Credit: Samsung)
RAPID
The RAPID technology uses the computer host SDRAM as an extra level of cache. In the latest iteration of RAPID, the cache size is still dynamic, 25% of the host RAM up to 4GB, split 50/50 between read and write. The cache size has been increased to a maximum of 4GB. Only host computers equipped with 16GB RAM or more would see the 4GB cached. Running benchmarks on an 8GB host machine with task manager up, I could see, via the “nonpaged” pool, the memory cache size increases up to 2GB and drops down to 1GB.
Since RAPID uses the host RAM, high performance RAM will see higher I/O performance.
Because of RAPID follows the OS flush command, Samsung stated that the risk of data loss due to unexpected power is not higher than a typical system. It is conceivable in the previous version where the cache size was up to 1GB. However, when the cache is at his maximum size, 4GB, there are much more data to be flushed in the same amount of time.

Samsung EVO RAPID technology
The most noticeable about the write cache is it focuses on small random I/O by collating the data and writes it back in larger blocks. The read cache is persistent, meaning a copy of the data map is written to disk every so often. Finally, the latest RAPID in the Magician 4.4 is compatible with the previous Samsung SSD drives, I tested with the Samsung EVO 1TB mSATA.
Dynamic Thermal Guard
Heat is a concern when dealing with an enclosed environment such as a laptop or notebook when air flow is a premium. The Dynamic Thermal Guard throttles the controller clock if the temperature reaches a certain threshold.
Software Package
“Samsung Data Migration” is a convenient disk cloning software by Clonix. The utility will always detect the OS drive as the source, which is a good failsafe. It only works if at least one SSD is a Samsung. At this time, it is Windows only. The latest version 2.7 put a new restriction, it only recognized Samsung SSD as the target drive. The previous version would only care if at least one drive was a Samsung product. Although the Samsung Data Migration will get the job done, truth to be told, I like the Intel Data Migration better. It has a couple more features such as, create a bootable media rescue disk and a drive cleanser tool. Although “secure erased” would be as efficient.

The Magician 4.4, also Windows only, is well designed and all vital information is readily available. Firmware updates and customized over-provisioning can be set up with one click of the mouse. With another couple of mouse clicks, the OS is optimized for the SSD. There is no need to navigate through Windows registry keys and make changes. In doubt, “Maximum Reliability” is a good option.


Testing Protocol
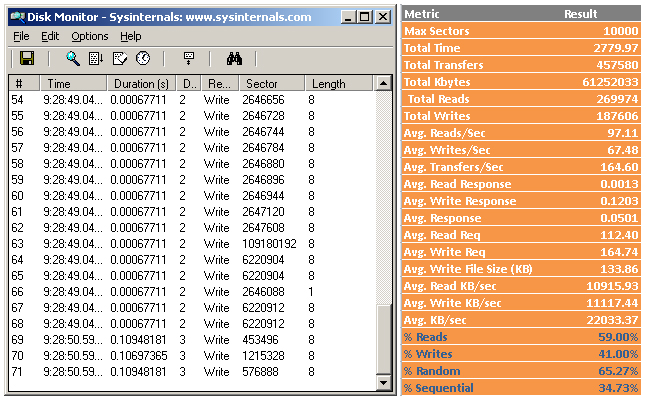
I went through most of the popular benchmark tools, AS SSD, CrystalDiskMark, ATTO, IoMeter, Anvil’s Storage Utility v1.1.0 and PCMark Vantage. But I also used performance monitoring tools such as DiskMon and hIOmon, primarily to validate the tests. Instead of posting chart after chart, I believe, as a consumer, what is important is how the product fits the needs and not chasing after uber high numbers which are only attainable during benchmarking. For this review, I narrowed it down to Anvil’s Storage Utility, PC Mark Vantage Licensed Pro version, CrystalMark and PCMark8.
Drive conditioning: The SSDs were prepped with Windows 7 (from an image), filled with about 120GB of data total and benchmarks were run from the tested unit acting as the OS drive.
Steady state: This state occurred overtime when the drive went through enough write cycles, or to be more specific program/erase (P/E) cycles, that write performances were consistent or stable. It may take a few weeks before the SSD reaches it, depending on the computing usage, but it can be accelerated using IoMeter.
In summary, Steady State is: Written Data = User capacity x 2, at least.
| Benchmark Workstation Main Components | |
| CPU | Intel Core i3-2120 Processor @3.30GHz |
| Motherboard | ASUSTeK Computer INC. P8Z77-V LX |
| RAM | 8,192 MB (4,096 x 2) PNY Optima DDR3 – PC3-10666 |
| GPU | NVIDIA GeForce GTS 450 |
| OS | Windows 7 Pro 64bits |
| Storage Driver | iaStorA 12.9.0.1001 |
| OS Hard Drive | The reviewed SSD unit |
What numbers are relevant in a real world usage?
Keep in mind that unlike synthetic benchmarks which perform only one specific operation at the time for a predetermined duration, seq read, then seq write then random read, and so on and so forth, real world usage paints a different picture. All four access types can occur at any time, and different transfer rates and different (I/O access) percentages. For instance, a storage subsystem on a streaming server would mostly see high seq read I/O, large block reads, with very little to none write. Looking at a database server without blob data type, we would probably see 75% random read, 20% random write and 5% random and seq write. I could either guesstimate the different ratios or figure a method to define a more accurate I/O usage baseline.
I/O Baseline
While it is entertaining to run a bunch of benchmarking tools, expecting huge numbers, the purpose of testing the units is to get a good look at how they perform under realistic desktop usage pattern. That is why I picked PCMark Vantage suite as my usage pattern. By capturing and analyzing I/O during the PCVM run, disk operations are breakdown to percentage read vs. write, random vs. sequential, queue depth and average file transfer size.
With that information, benchmarking makes more sense since all the numbers do not carry the same importance, thus some results are more valuable than others.
In summary, I/O pattern defines what I need from the device vs. what can the device do overall.
The I/O baseline process was explained in the Intel 525 mSATA review.
From the numbers, I rated the I/O usage by activity as follow: Random Read > Random Write > Seq Read > Seq Write and average file size is 128K.
To cover Queue Depth, I used hIOmon during the PC Vantage full run. There is a trial version for a week, which is enough time to build the baseline. Based on the chart below, it is obvious that a benchmark score from a QD 16 (or more) does not carry the same weight as a score from a QD 1.

About 95%+ of the reads/writes I/O are at or under Queue Depth 4. Although the bulk of it is at Queue Depth 2 or under.
Performance

ASU. RAPID mode disabled.

ASU. RAPID mode enabled.

Values are in MB/s. Higher is better.

Values are in MB/s. Higher is better.

Values are in MB/s. Higher is better
Strangely enough the writes test did not fully reflect the use of RAPID with Anvil’s Storage Utilities. I reran a series of test with CrystalDiskMark. CMD output is closer to what I expected to see regarding writes with RAPID enabled.

Left: RAPID disabled. Right: RAPID enabled.
Next up, is PC Mark Vantage. With RAPID off, the 850 PRO scores are the highest I have seen so far. With RAPID enabled, it is not even a contest.

After seeing incredible numbers from synthetic benchmarks, I feel important to temper the expectations by testing the product in a context comparable to a home usage pattern. “PCMark 8 storage” relies on traces recorded from the most popular applications and games to provide real-word performance.
I split the output in two parts. Results from the traces based benchmarks of the different applications and the overall score with the bandwidth usage.

PCMark 8 Storage. Value in seconds. Lower is better.

Storage bandwidth in MB/s. Higher is better.
Based on the results, there is a discrepancy between the bandwidth score and the storage score, which itself is an aggregation of all the traces based applications. Let alone the comparison between the different SSDs, one would expect a higher margin between RAPID enabled and disabled. The only logical explanation I could come up with is, there must be some latency at the application level. As is often the case, the software has to play catch up with the hardware.
Conclusion
The 850 PRO is an impressive piece of technology. By going vertically the 3D V-NAND opens the path to much higher SSD capacity in the near future, we are talking 8TB by 2017. For now, it offers pretty much everything the consumer would want to see from an SSD, performance, high endurance, encryption, low power consumption, great software package and backed by a 10 years limited warranty.
So, what is missing from the perfect picture? The first item is “Power loss protection”. It can be mitigated when the product is used in a laptop, since the battery can act as a UPS. Althoough one can argue that a UPS system in a must in a home desktop environment. Second, is pricing. Based on the MSRP provided by Samsung, cost per GB is on the higher end. I can see both sides of the debate. On one hand, it is a new technology, with a 10 years limited warranty and based on performance and features it worth the price. On the other hand, there are other options (e.g. EVO, MX100) with twice the capacity for the same price. Synthetic benchmarks are not real-world performance and no users would pass a blindfold test between an 840 EVO and a 850 PRO anyway.
What really matters is, Samsung is putting a lot of pressure on the other SSD manufacturers with the 850 PRO series and the upcoming 850 EVO line. And that, can only benefit the consumer in the end.
If I were in the market for an SSD, for a desktop system, within a $200 range, I would probably look at the MX100 512GB or the EVO 500GB. Ideally, I would wait for the 850 EVO series.
Filed in . Read more about Samsung, Samsung Reviews and Ssd.